You’ve seen them. A chart overlay of your website that shows where people on the site clicked. Marketing people get really excited about these. They can show their bosses that they’re using some really space-age technology to improve the site. Never once have I heard, “So what? It doesn’t mean they’re purchasing.”
In eCommerce, we’re often trying to ascertain which sections of our site are driving the most value. I’m sure your team has some sort of methodology for this, relying on some awesome tools to improve the overall conversion rate of your site. A typical methodology I see is use of a heat map tool (CrazyEgg, Hotjar, Full Story) to see where users are interacting and clicking on the site. In the best-case scenario, folks in the company use these results to form a hypothesis as to why people interact with this particular feature and what that could mean. Maybe it even opens up an AB test with another set of tools (Google Optimize, Optimizely, etc.) to see if the hypothesis can lead to more conversions. That’s a process that can take weeks in the best case. In the worst case, you’re paying for tools that spit out some pretty charts and nothing more.
One alternative (or complement) I’d like to share is a better usage of Google Analtyics to tie these actions to revenue in one system. What do I mean? We all know event tracking can be added to your site. I like to go overboard and tag almost every element possible on each page. This will essentially build you a list-style replacement of the pretty click map images. What’s better (assuming all is labeled well) is you’ll start to see patterns between what events are hit on site vs. dollars generated – think about it as conversion rate per event or revenue per event.
How to set up
- You’ll need to tag all events on the page. You can do this through Google Tag Manager and Google Analytics. The most important step here is to name all events with a standard naming convention, or else setting up your reports later will be a major issue.
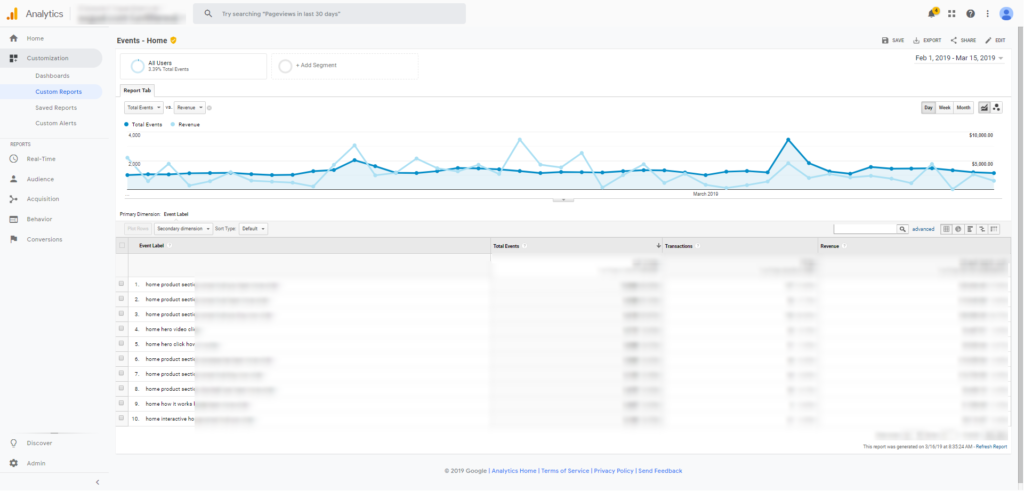
- Once tagged and firing, jump into Google Analytics and create a custom report.
- Dimension: Event Action or Event Label (depending on how you’ve chosen to name your events)
- Metrics: Total Events, Transactions, Revenue
- I suggest you roll this out one per page so you can drill down easily.
- Export your report and tack on a Revenue/Events and Transactions/Events formula for each event. Now you’ve got a list of which events are relatively driving the most value!
Note – Obviously, some events on your site are geared more toward someone new to the brand and some are geared for someone who already knows about you (eg. events in your cart will by nature drive more revenue for you). This is why it pays to have a reasonable analyst drawing conclusions from the data.
Your report will look like this:
A few things I’ve learned from reports like this:
- In the case of one client, it’s extremely important that users can browse multiple products and price points in the same category. The event report showed that revenues are higher when users select “compare” options or jump between products.
- Clicks on some product features led to more revenue than clicks to other features. This helps us decide which product features to call out in paid advertising, on site, or anywhere we’re investing in new eyeballs.
- You know those social icons on the bottom of your footer? Tagging these with events can tell you which social platforms to focus your time on! Why keep posting on Facebook if your audience is leaving your site to go to YouTube? Too often there is a lack of alignment here.
- Videos on a repository page lead to the most revenue on site. By the way, it was not the videos I would have thought!
- Different payment options in cart led to the different conversion rates and revenue numbers per selection. This led to changes in terms of how those options were presented to users.
This is the entryway to future AB test prioritization. We too often test to appease someone. This offers your team the opportunity to test in order of revenue for the business
If you’d like to learn more about other hacks for your startup, please reach out to hello@flywheeldemand.com.